ESG Data
Human Resources
Ratio of Female Employees and Managers
Regular employees as of April
| 2021 | 2022 | 2023 | 2024 | 2025 | |||||||
|---|---|---|---|---|---|---|---|---|---|---|---|
| Men | Ratio of female to male employees (%) |
Men | Ratio of female to male employees (%) |
Men | Ratio of female to male employees (%) |
Men | Ratio of female to male employees (%) |
Men | Ratio of female to male employees (%) |
||
| Women | Women | Women | Women | Women | |||||||
| Benesse Corporation | Employees | 1,087 | 53 | 1,127 | 52 | 1,173 | 52 | 1,651 | 48 | 1,708 | 48 |
| 1,218 | 1,220 | 1,259 | 1,544 | 1,561 | |||||||
| Section managers | 149 | 35 | 157 | 35 | 143 | 38 | 185 | 36 | 172 | 39 | |
| 82 | 85 | 89 | 103 | 111 | |||||||
| Departmental directors | 47 | 33 | 67 | 31 | 71 | 29 | 72 | 27 | 69 | 30 | |
| 23 | 30 | 29 | 27 | 29 | |||||||
| Executives | 11 | 15 | 9 | 10 | 13 | 13 | 13 | 13 | 23 | 12 | |
| 2 | 1 | 2 | 2 | 3 | |||||||
| Benesse Style Care | Employees | 3,597 | 64 | 3,585 | 64 | 3,624 | 64 | 3,628 | 64 | 3,682 | 64 |
| 6,267 | 6,430 | 6,521 | 6,506 | 6,570 | |||||||
| Section managers | 317 | 37 | 329 | 37 | 340 | 36 | 341 | 37 | 625 | 48 | |
| 190 | 190 | 194 | 198 | 567 | |||||||
| Departmental directors | 87 | 17 | 86 | 20 | 87 | 22 | 90 | 20 | 98 | 23 | |
| 18 | 22 | 25 | 23 | 29 | |||||||
| Executives | 9 | 10 | 9 | 10 | 8 | 20 | 8 | 20 | 6 | 25 | |
| 1 | 1 | 2 | 2 | 2 | |||||||
Number of Hires by Gender (Benesse Corporation)
Fiscal year ended March 31 of each year
| 2022 | 2023 | 2024 | 2025 | 2026* | ||
|---|---|---|---|---|---|---|
| New graduates | Male | 29 | 35 | 52 | 61 | 67 |
| Female | 37 | 24 | 40 | 36 | 33 | |
| Total | 66 | 59 | 92 | 97 | 100 | |
| Mid-career | Male | 68 | 104 | 105 | 96 | — |
| Female | 27 | 81 | 60 | 47 | — | |
| Total | 95 | 185 | 165 | 134 | — | |
| Total | 161 | 244 | 257 | 243 | — | |
*as of April 2025
Ratio of Employees with Disabilities (Benesse Group)
As of June 1
| 2021 | 2022 | 2023 | 2024 | 2025 | |
|---|---|---|---|---|---|
| Ratio of Employees | 2.47% | 2.54% | 2.51% | 2.60% | 2.60% |
- * Ratio of employees with disabilities at Group companies subject to the Employment Quota System for Persons with Disabilities
Number of Employees Who Took Childcare Leave and Returned from Leave
Fiscal year ended March 31 of each year
| 2021 | 2022 | 2023 | 2024 | 2025 | |||||
|---|---|---|---|---|---|---|---|---|---|
| Number of Employees Taking Leave | Number of Returnees | Number of Employees Taking Leave | Number of Returnees | Number of Employees Taking Leave | Number of Returnees | Number of Employees Taking Leave | Number of Returnees | Number of Employees Taking Leave | |
| Benesse Corporation (full-time employees, specialists, contract employees) | 52 | 59 | 76 | 85 | 80 | 84 | 123 | 92 | 112 |
| Benesse Style Care (full-time employees, specialists, associate employees) | 252 | 232 | 301 | 225 | 307 | 267 | 312 | 240 | 292 |
- * Returnees: Employees who return to work within the time limit for leave under each company's system
Ratio of men taking childcare leave
Year ended 31 March of each year (%)
| 2021 | 2022 | 2023 | 2024 | 2025 | |
|---|---|---|---|---|---|
| Benesse Corporation (full-time employees, specialists, contract employees) |
49 | 51 | 51 | 66 | 73 |
| Benesse Stlye Care (full-time employees, specialists, associate employees) |
58 | 49 | 58 | 65 | 85 |
Number of employees who have obtained shorter working hours for childcare
As of April
| 2021 | 2022 | 2023 | 2024 | 2025 | |
|---|---|---|---|---|---|
| Benesse Corporation (full-time employees, specialists, contract employees) |
50 | 53 | 58 | 41 | 59 |
| Benesse Style Care (full-time employees, specialists, associate employees) |
280 | 280 | 290 | 299 | 326 |
Number of Employees Receiving Childcare Allowance (Benesse Style Care)
As of June
| 2021 | 414 |
|---|---|
| 2022 | 381 |
| 2023 | 411 |
| 2024 | 378 |
| 2025 | 423 |
Work-life Management Data (Benesse Corporation)
Fiscal year ended March 31 of each year / Full-time employees
| 2021 | 2022 | 2023 | 2023 | 2025 | ||
|---|---|---|---|---|---|---|
| Overtime work hours* | 38.2 hours | 39.6 hours | 38.9 hours | 41.0 hours | 39.5 hours | |
| Annual leave utilization rate | 52% | 54% | 60% | 60% | 61% | |
| Number of employees taking nursing care leave | 1 | 2 | 1 | 3 | 4 | |
| Average years of continuous service | Men | 12.2 | 13.1 | 12.6 | 10.1 | 9.6 |
| Women | 13.0 | 14.3 | 13.8 | 12.2 | 12.5 | |
* Prescribed working hours: 7 hours/day
Gender wage differential (ratio of women's wages to men's wages)
Year ended 31 March (%)
| 2023 | 2024 | 2025 | |||||||
|---|---|---|---|---|---|---|---|---|---|
| fulltime employment | Part-time/fixed-term employment | all workers | fulltime employment | Part-time/fixed-term employment | all workers | fulltime employment | Part-time/fixed-term employment | all workers | |
| Benesse Corporation (full-time employees, specialists, contract employees) |
85 | 88 | 71 | 88 | 91 | 77 | 86 | 91 | 76 |
| Benesse Stlye Care (full-time employees, specialists, associate employees) |
94 | 109 | 91 | 94 | 109 | 92 | 93 | 109 | 91 |
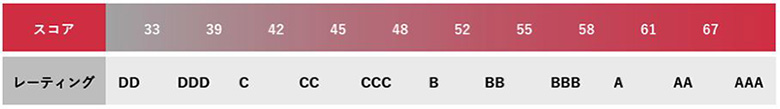
Employee Engagement (Benesse Group)
(Year ended 31 March of each year)
| 2022 |
2023
|
2024
|
|||
|---|---|---|---|---|---|
| June | November | June | November | ||
| Engagement rating | A | BBB | BBB | A | BBB |
※Engagement Ratings:
An indicator of the degree of engagement (mutual understanding and affinity) between a company and its employees.
There are 11 rating levels from AAA to DD.
Employee training costs (Benesse Corporation)
Fiscal year ended March 31 of each year
| 2021 | 2022 | 2023 | 2024 | 2025 | |
|---|---|---|---|---|---|
| Total (millions of yen) | 131 | 132 | 176 | 219 | 285 |
| Cost per person (yen) | — | 91,411 | 76,905 | 84,401 | 81,500 |
| Time per person (hours) | — | 21.9 | 25.5 | 23.3 | 19.6 |
Environment
Water policy (included in environmental policy)
Policy for reduction in water usage
Benesse Corporation's Okayama and Tokyo headquarters underwent sanitary plumbing work. During this process, we renovated the toilets to reduce water and wastewater consumption in the offices.
| Plan | Results (Reduction rate) | |
|---|---|---|
| Okayama Head Office (FY2023) | Reduction from base year water and sewage usage | 5,764m³ (58.5%) |
| Tokyo Headquarter (FY2023) | 10,085m³ (47.4%) |
* Base year: Okayama Headquarters (FY2017), Tokyo Headquarters (FY2019)
Biodiversity policy (included in environmental policy)
Scope 1, 2 and Scope 3 Reduction Targets
<Benesse Corporation>
Fiscal year ending March 31 of each year
| Every fiscal year* | 2030* | 2041 | 2050* | |
|---|---|---|---|---|
| Reduction rate for Scope 1 and 2 using 2018 as the baseline year | 4.4% | 52.8% | 100% | 100% |
* Reduction target has been certified by SBTi
[Date of revision September 29, 2022]
Fiscal year ending March 31 of each year
| Every fiscal year | 2030 | 2050 | |
|---|---|---|---|
| Reduction rate of Scope 3 using 2018 as the baseline year | 1.23% | 14.8% | 39.4% |
2°C target certified by SBTi
< Benesse Group >
Fiscal year ending March 31 of each year
| 2030 | 2041 | |
|---|---|---|
| Reduction rate for Scope 1 and 2 using 2022 as the baseline year | 42.4% | 100% |
Scope 1, 2 and Scope 3 Reduction Results
<Benesse Corporation>
Scope 1, 2 and Scope 3 Reduction Results
Fiscal year ended March 31 of each year
| Units:t-CO2 | Base year results | Results | Results |
|---|---|---|---|
| 2018 | 2024 | 2025 | |
| Scope 1 | 120 | 294 | 410 |
| Scope 2 | 7,477 | 4,327 | 4,306 |
| Scope 3 | 220,450 | 149,400 | 138,695 |
| Total of Scope 1, 2, and 3 | 228,047 | 154,021 | 143,411 |
| YoY change | 93.68% | 93.11% |
Date of revision February 20, 2026
[CO2 emissions by scope]
Fiscal year ended March 31 of each year
| Unit: Tons CO2 | 2023 | 2024 | 2025 | ||
|---|---|---|---|---|---|
| Scope 1 | 73 | 294 | 410 | ||
| Scope 2 | 2,989 | 4,327 | 4,306 | ||
| Scope 3 | 161,356 | 149,400 | 138,695 | ||
| 1 | Purchased products and services | 136,531 | 127,079 | 116,291 | |
| 2 | Capital goods | 4,457 | 4,806 | 5,230 | |
| 3 | Fuel and energy activities that do not fall under Scope 1 and 2 | 800 | 918 | 990 | |
| 4 | Transportation and distribution (upstream) | 2,755 | 1,494 | 1,296 | |
| 5 | Waste generated from operations | 515 | 553 | 500 | |
| 6 | Business trips | 2,671 | 3,377 | 3,481 | |
| 7 | Employee commuting | 1,278 | 1,416 | 1,543 | |
| 8 | Leased assets (upstream) | 0 | 0 | 0 | |
| 9 | Transportation and distribution (downstream) | 6,763 | 4,757 | 5,139 | |
| 10 | Fabrication of sold products | 0 | 0 | 0 | |
| 11 | Use of sold products | 304 | 279 | 188 | |
| 12 | Disposal of sold products | 5,282 | 4,721 | 4,037 | |
| 13 | Leased assets (downstream) | 0 | 0 | 0 | |
| 14 | Franchises | 0 | 0 | 0 | |
| 15 | Investments | 0 | 0 | 0 | |
| Total of Scope 1, 2, and 3 | 164,418 | 154,021 | 143,411 | ||
Date of revision February 20, 2026
<Benesse Group>
● Scope 1, 2 and Scope 3 Reduction Results
Fiscal year ended March 31 of each year
| Unit:t-CO2 | Base year results | Results | Results |
|---|---|---|---|
| 2022 | 2024 | 2025 | |
| Scope1 | 13,447 | 10,552 | 11,009 |
| Scope2 | 43,085 | 39,971 | 44,475 |
| Total of Scope 1 and 2 | 56,532 | 50,523 | 55,484 |
| YoY Change | 94.84% | 109.82% |
Date of revision February 20, 2026
● Scope 3 Reduction Results
Fiscal year ended March 31 of each year
| Unit:t-CO2 | Base year results | Results | Results |
|---|---|---|---|
| 2023 | 2024 | 2025 | |
| Scope3 | 404,762 | 372,882 | 378,829 |
| Total of Scope 1, 2 and 3 | 461,294 | 423,405 | 434,313 |
| YoY Change | 91.79% | 102.58% |
Date of revision February 20, 2026
* Scope 3 of the group has started to be calculated from the 2023 results
Energy Consumption, Water use, Waste Generation
<Benesse Corporation>
Fiscal year ended March 31 of each year
| Units | 2023 | 2024 | 2025 | |
|---|---|---|---|---|
| Electricity | MWh | 7,624 | 7,579 | 9,069 |
| Heat | Thousands GJ | 9 | 10 | 10 |
| City gas | Thousands m³ | 26 | 29 | 36 |
| Heavy Oil A | ℓ | 78 | 66 | 36 |
| Gasoline | ℓ | 5,444 | 101,843 | 124,614 |
| Diesel oil | ℓ | - | - | 19,043 |
| Water use | Thousands m³ | 31 | 28 | 28 |
| Waste (paper) emissions | t | 1,196 | 1,475 | 1,180 |
| Waste (industrial wastes) emissions | t | 475 | 623 | 486 |
Date of revision February 20, 2026